CupInfo Home | 2024 Results: RR1 | Schedule | Previous Events | Feature Articles | Books | CupStats
Other Pages:
2013 Louis Vuitton Cup: Louis
Vuitton Cup Results | LVC
Final Race 7 Stats | CupStats Home
Also on this page (click or scroll down):
ETNZ vs. Luna Rossa vs. Oracle Team USA: Speed over Ground (SOG)
| Velocity Made Good (VMG)
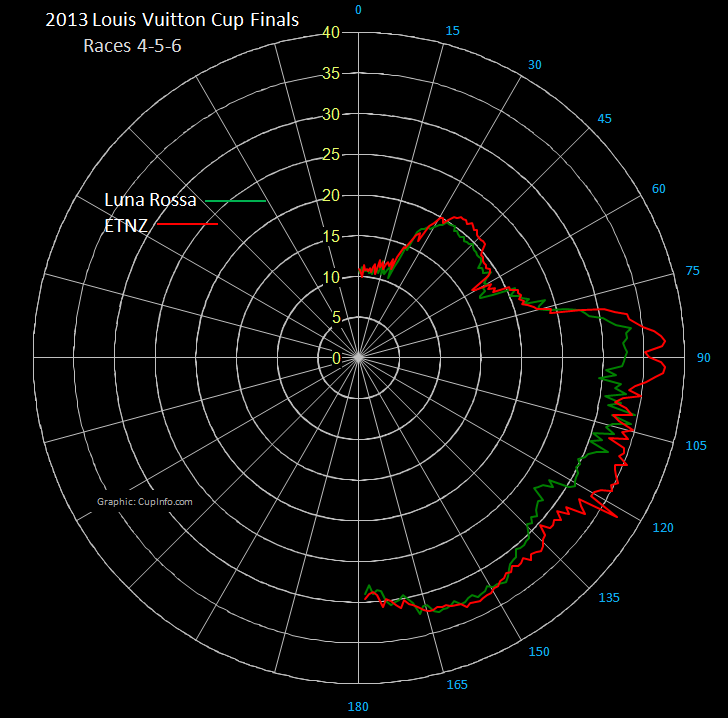
Polar Plot for Emirates Team New Zealand vs. Luna Rossa Challenge:
Average Speed-Over-Ground (SOG) at
True-Wind-Angle (TWA)

The plot above shows simple average boat speed at true wind angles based on Races 4, 5, and 6 of the 2013 Louis Vuitton Cup Final. Boat speed in knots is plotted as distance from the center (marked in the yellow numbers) and true wind angle is plotted as degrees from the vertical (marked in the blue numbers). Zero degrees, straight up on the plot, is straight into the wind. 180 degrees, straight down on the plot, is directly downwind.
Over the three LVC Finals races sailed in full by
the two boats, ETNZ released 23,000 data points and LunaRossa over 25,000.
Wind strength was medium, with 82% of race time in the 12-16 knot range.
ETNZ showed higher speed upwind, downwind, and during the reaching legs (TWA
between 85 and 120 degrees), when her advantage is greatest.
Luna
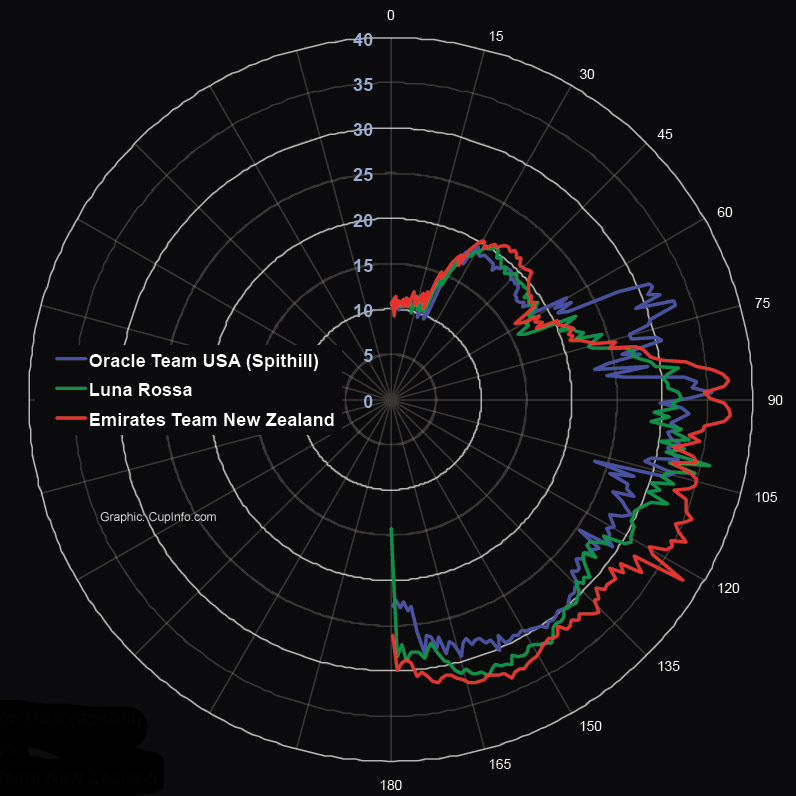
Rossa-ETNZ-Oracle Team USA Polars:
SOG: Average Boat Speed (SOG) at True-Wind-Angle (TWA):

SOG comparison within the 10-15 knot wind range only, based on availability of
comparable data from all boats.
Oracle Team USA data was recorded in the Defender's Practice Race.
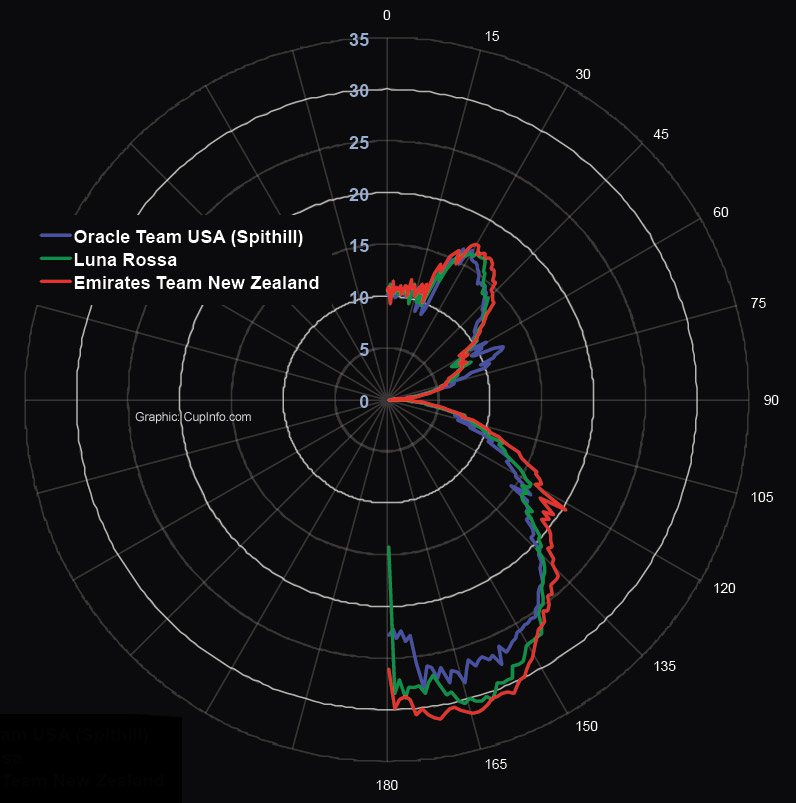
VMG: Velocity Made Good (VMG) at True-Wind-Angle (TWA):
SOG comparison within the 10-15 knot wind range only, based on availability of comparable data from all boats.
Velocity Made Good (VMG) is calculated in this case as the direct upwind or downwind component of velocity, depending on leg of the race course.
Inquiries please contact: