CupInfo Home | 2024 Results: RR1 | Schedule | Previous Events | Feature Articles | Books | CupStats
Welcome to CupStats!
2024 Louis Vuitton Cup Round Robin 1
2017 America's Cup:
Emirates Team New Zealand vs. Oracle Team
USA
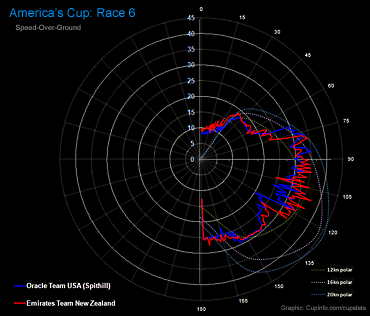
Speed Over Ground

Click image to see graphs
of 2017 America's Cup Match Race Data
2017 America's Cup:
Results and Standings
CupStats from Previous America's Cup Events:
America's Cup 2013 - ETNZ vs. Oracle Team USA:
| Win When Leading at Mark:
Percentage of Races Won when Yacht is Leading at Each Mark of
the Course: |
 |
| Pre-Start Entry Side and Wins:
Relationship of Pre-Start Entry (Port/Starboard), Tidal
Current, and Relative Position Relative to Leading at Mark 1 and Winning Race: |
 |
Polar Plots: Boatspeed and Velocity-Made-Good Boat speed (Speed-Over-Ground) by race(s) and by team at each angle relative to the wind through the race, plus upwind or downwind Velocity-Made-Good (VMG) for the same races. See SOG/VMG for America's Cup Match Related: |
 |
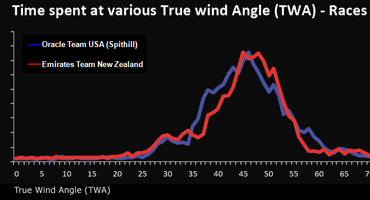
TWA: True-Wind-Angle Frequency by Boat Time spent at each angle relative to the wind throughout the race: See TWA Frequency |
 |
| Wind Distribution Frequency of winds recorded on the course by races: See Wind Distribution |
 |
| Tacking Efficiency: Team vs. Team Speed maintained through
tacks, and change in wind angle, from 10 seconds before to ten seconds after a
tack, compared by team: |
 |
| Gains and Leads: Gains and Leads (Deltas) on each Leg for each Race: View Graphs |
 |
| Data Tables: Race-by-Race Timing, Course, Wind, Boatspeed, TWA, AWA, and VMG by each leg by each race for both boats: View Race Data |
 |
| Speed Maps: Speed-Over-Ground plotted per leg, classified
by color. See Speed Maps for: |
 |
| Race Durations: Length of time for each Race, Race-by-Race and per leg: View comparison |
 |
|
Click images above to view pages |
Also:
![]() Replay Entire Races while accessing data with LiveLine Race Viewer at
CupExperience
Replay Entire Races while accessing data with LiveLine Race Viewer at
CupExperience
Other Events:
2013 Louis Vuitton Cup: Louis Vuitton Cup Stats | LVC Results
Previous Event Stats: See detailed stats for the 2007 America's Cup & Louis Vuitton Cup
Inquiries please contact: editor@cupinfo.com